HOW TO EXPLORE SOLANA DAPP ACTIVITY AND NETWORK USAGE WITH SOLANA COMPASS
Solana Compass provides real-time blockchain analytics including total TPS, user TPS, vote TPS, block times, and fee data. The platform's performance dashboard allows users to monitor network health, validator activity, and dApp usage patterns, helping developers and investors understand Solana's actual ecosystem activity versus validator operations

HOW TO EXPLORE SOLANA DAPP ACTIVITY AND NETWORK USAGE WITH SOLANA COMPASS
When you want to see what's really happening across the Solana blockchain, from transaction speeds to network activity, Solana Compass is one of the best free tools available. It gives you real-time data about the network's health, transaction performance, and activity generated by decentralized apps (dApps). Whether you're a developer, investor, or curious user, learning how to read these metrics helps you understand how busy Solana really is and how efficiently it's running. Here's how to explore it step by step.
Step 1: Go to Solana Compass
Open
solanacompass.com*You'll land on a colorful dashboard showing "Decentralized Finance (DeFi) Protocols" *This is the main analytics hub that updates live with network data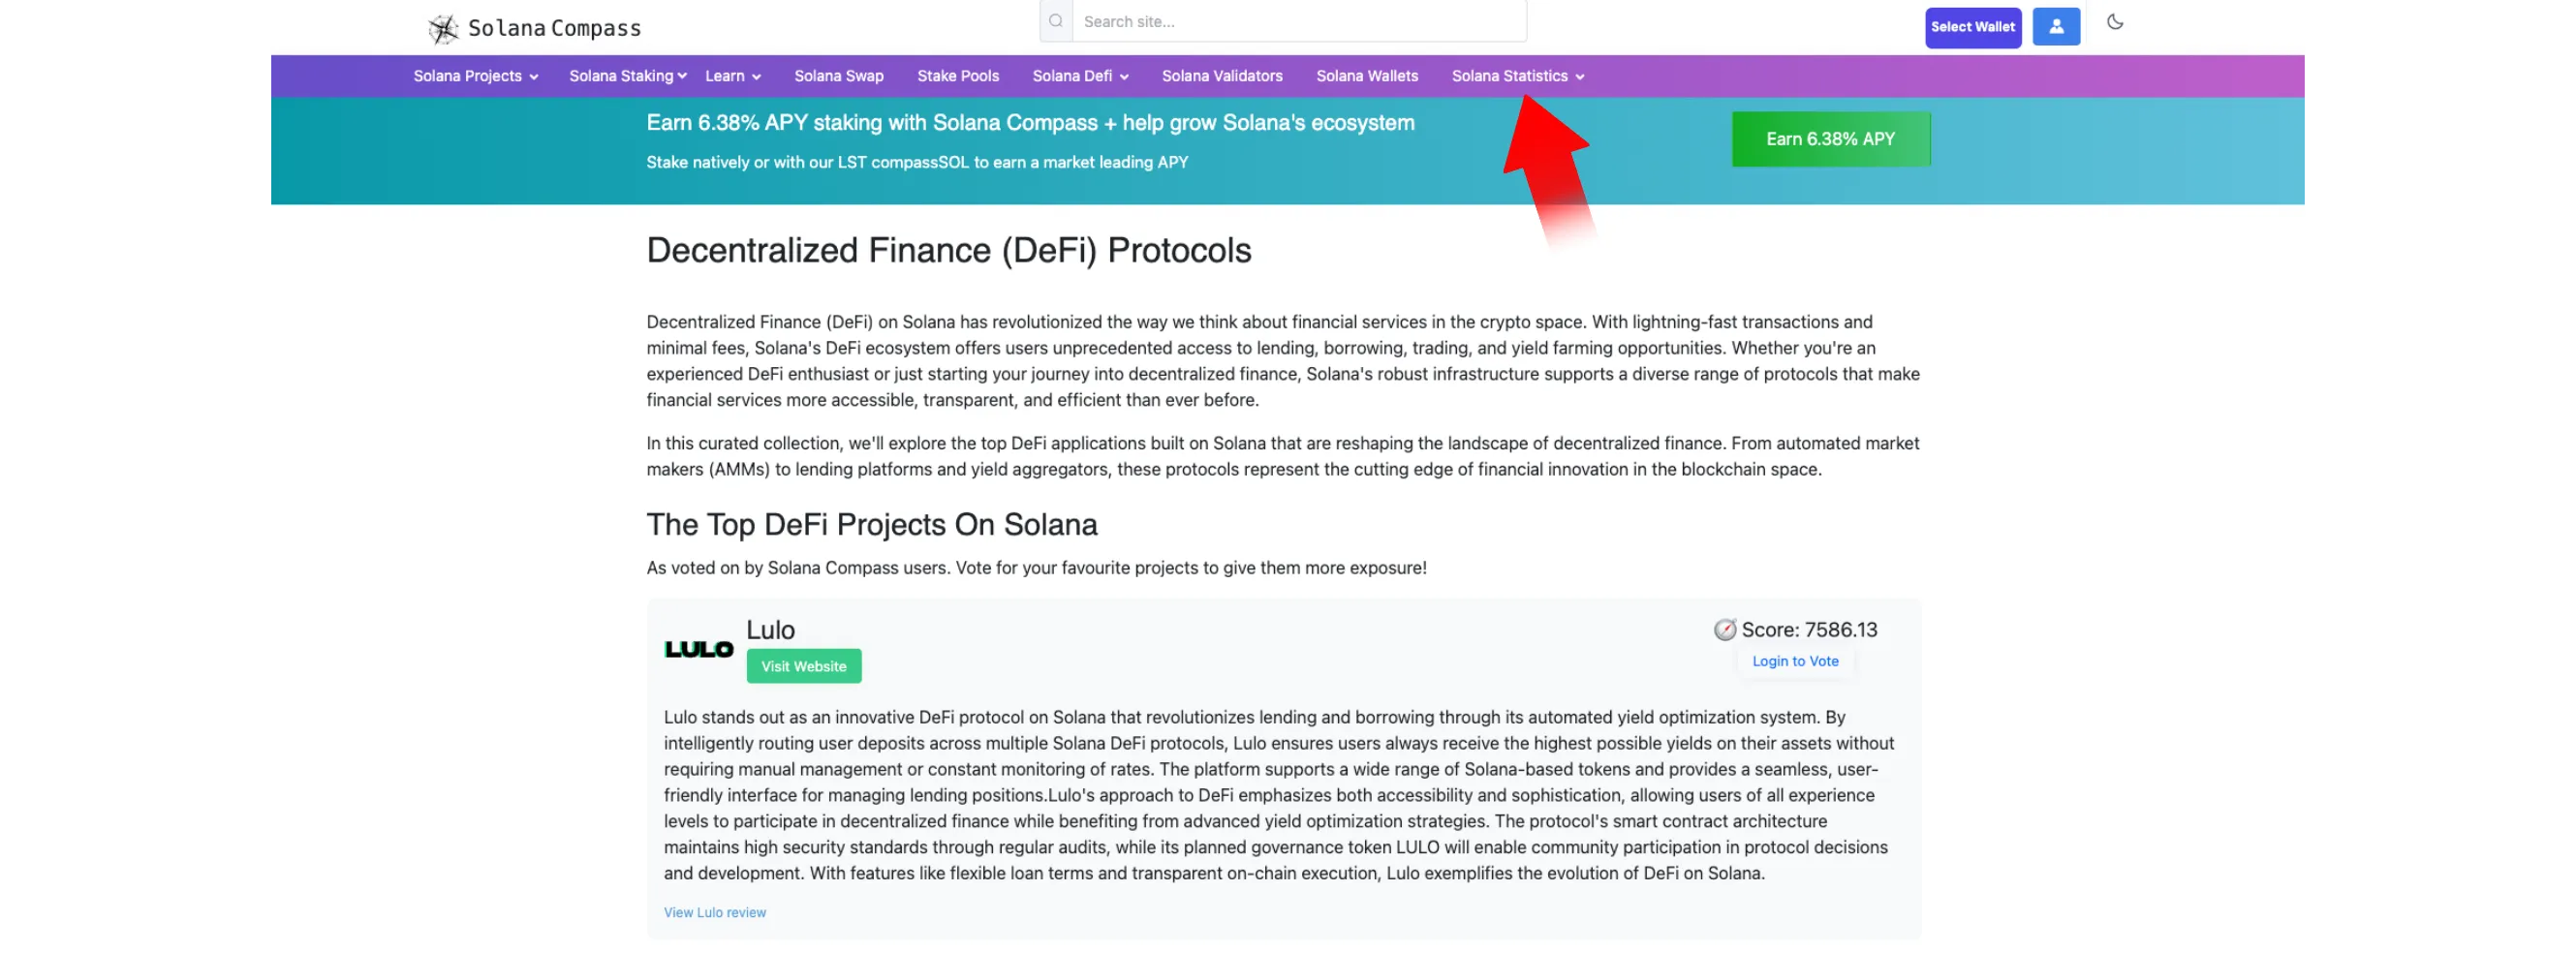
Step 2: Open the Network Performance Section
At the top menu, hover over "Solana Statistics" and click "Solana Performance + Transactions per Second" *This takes you to the Live Network Performance view, the center of Solana Compass's analytics *Here, you can monitor how many transactions are flowing through the chain every second and how much activity is coming from users versus validators

Step 3: Read the Key Metrics
Once you're on the dashboard, you'll see several live indicators
Each one represents a specific part of Solana's performance:
Total TPS (Transactions per Second) – The total number of transactions happening right now across the Solana network
User TPS – The portion of total TPS generated by real wallet and dApp activity. This reflects how busy the ecosystem actually is
Vote TPS – Transactions used by validators to confirm blocks. A higher number here means the network is actively validating and healthy
Average Block Time – How long it takes for a new block to be produced (typically around 400–500 ms on Solana)
Revenue (Fees + Tips) – Shows the current amount of fees generated per minute, indicating overall demand on the network
Median Fee – The average transaction cost; Solana's strength is keeping this extremely low
compassSOL APY and Price – Displays the staking rate and current value of Compass's liquid staking token
Together, these metrics give you a complete view of network usage and efficiency. A high User TPS with stable block times usually means multiple dApps are seeing strong activity.
Step 4: Explore Further Details
Below the main chart, click "View Detailed Live Stats" *This opens a breakdown with deeper information on epoch progress, transaction trends, and validator performance
You can use this data to identify:
When
Solanais most active during the dayHow validator voting affects overall throughput
How network performance changes when major dApps (like Jupiter, Meteora, or Tensor) experience spikes in activity

Tips for Interpreting the Data
User TPS > Vote TPS often signals strong organic usage, meaning actual wallet or DeFi transactions, not just validator chatter
Stable block times and low fees show that Solana is maintaining performance even during heavy load
Revenue changes can reflect increased demand or congestion; it's a simple way to gauge market activity without opening a trading terminal
Conclusion
Solana Compass turns complex blockchain data into a live, easy-to-read dashboard. By checking the Solana Performance → Transactions per Second section, anyone can monitor how active the Solana ecosystem really is. In addition, checkout this guide about HOW TO USE SOLANA BEACH TO TRACK SOLANA NETWORK UPGRADES
for more Solana tutorials. From validator operations to genuine dApp activity. Whether you're tracking DeFi usage, testing a project's impact, or just curious about Solana's speed, Compass offers a simple, visual way to understand it all in real time.