How to Track Solana Token Charts Using Birdeye
Track Solana token charts easily using Birdeye: view real-time prices, volume, liquidity, and recent trades in a clean interface with no wallet needed. Perfect for quick market analysis.

How to Track Solana Token Charts Using Birdeye
Birdeye is one of the fastest and most detailed tools for viewing Solana token charts.
Whether you're checking price movements, volume, or quick market activity, Birdeye shows everything in a clean and easy interface.
Here’s how to use it in just a few steps.
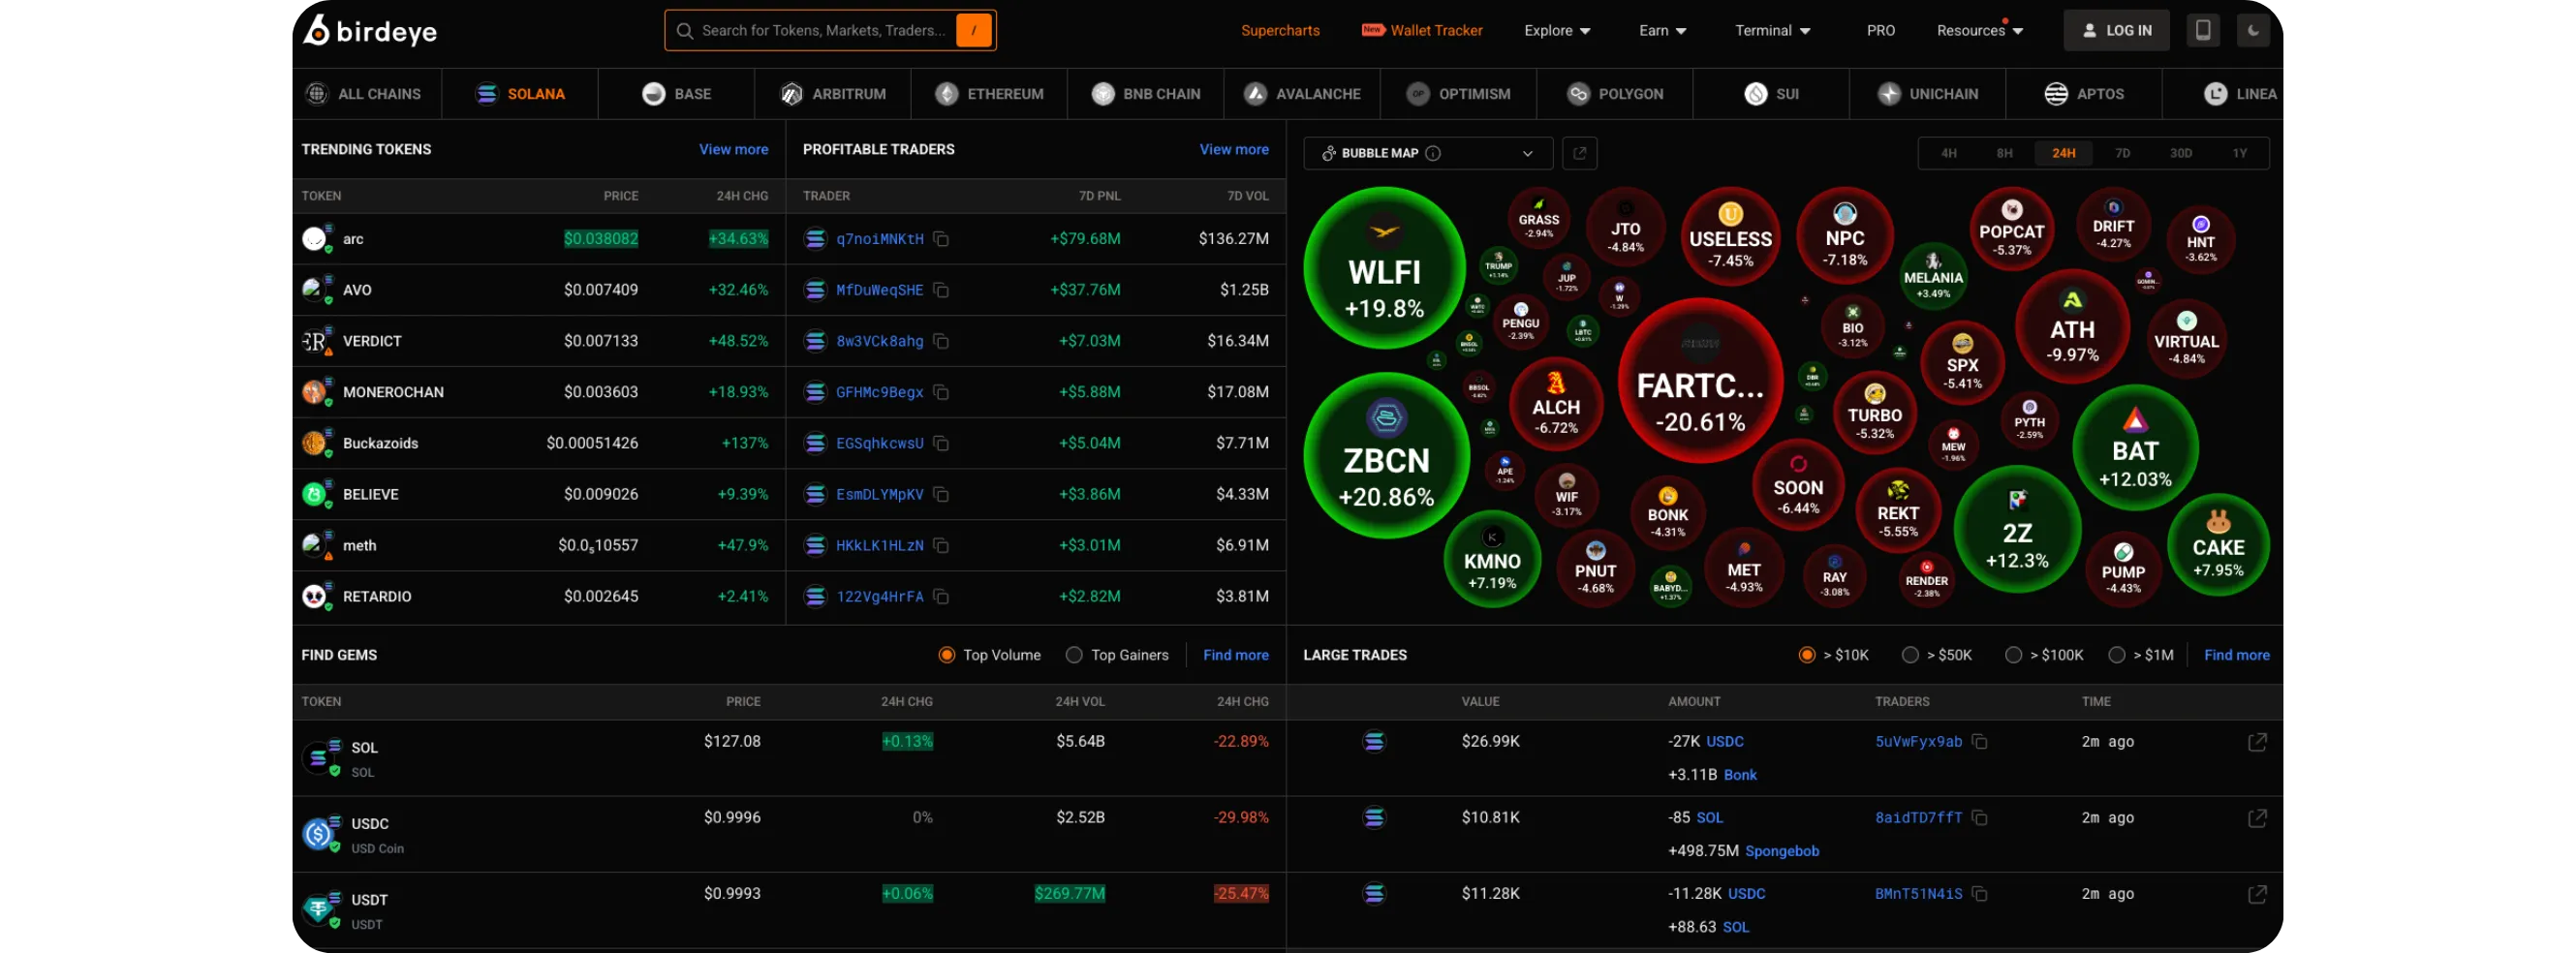
Step 1: Open Birdeye
Go to birdeye.so.
You’ll land on the homepage showing trending tokens, market movers, and a bubble-style heatmap.
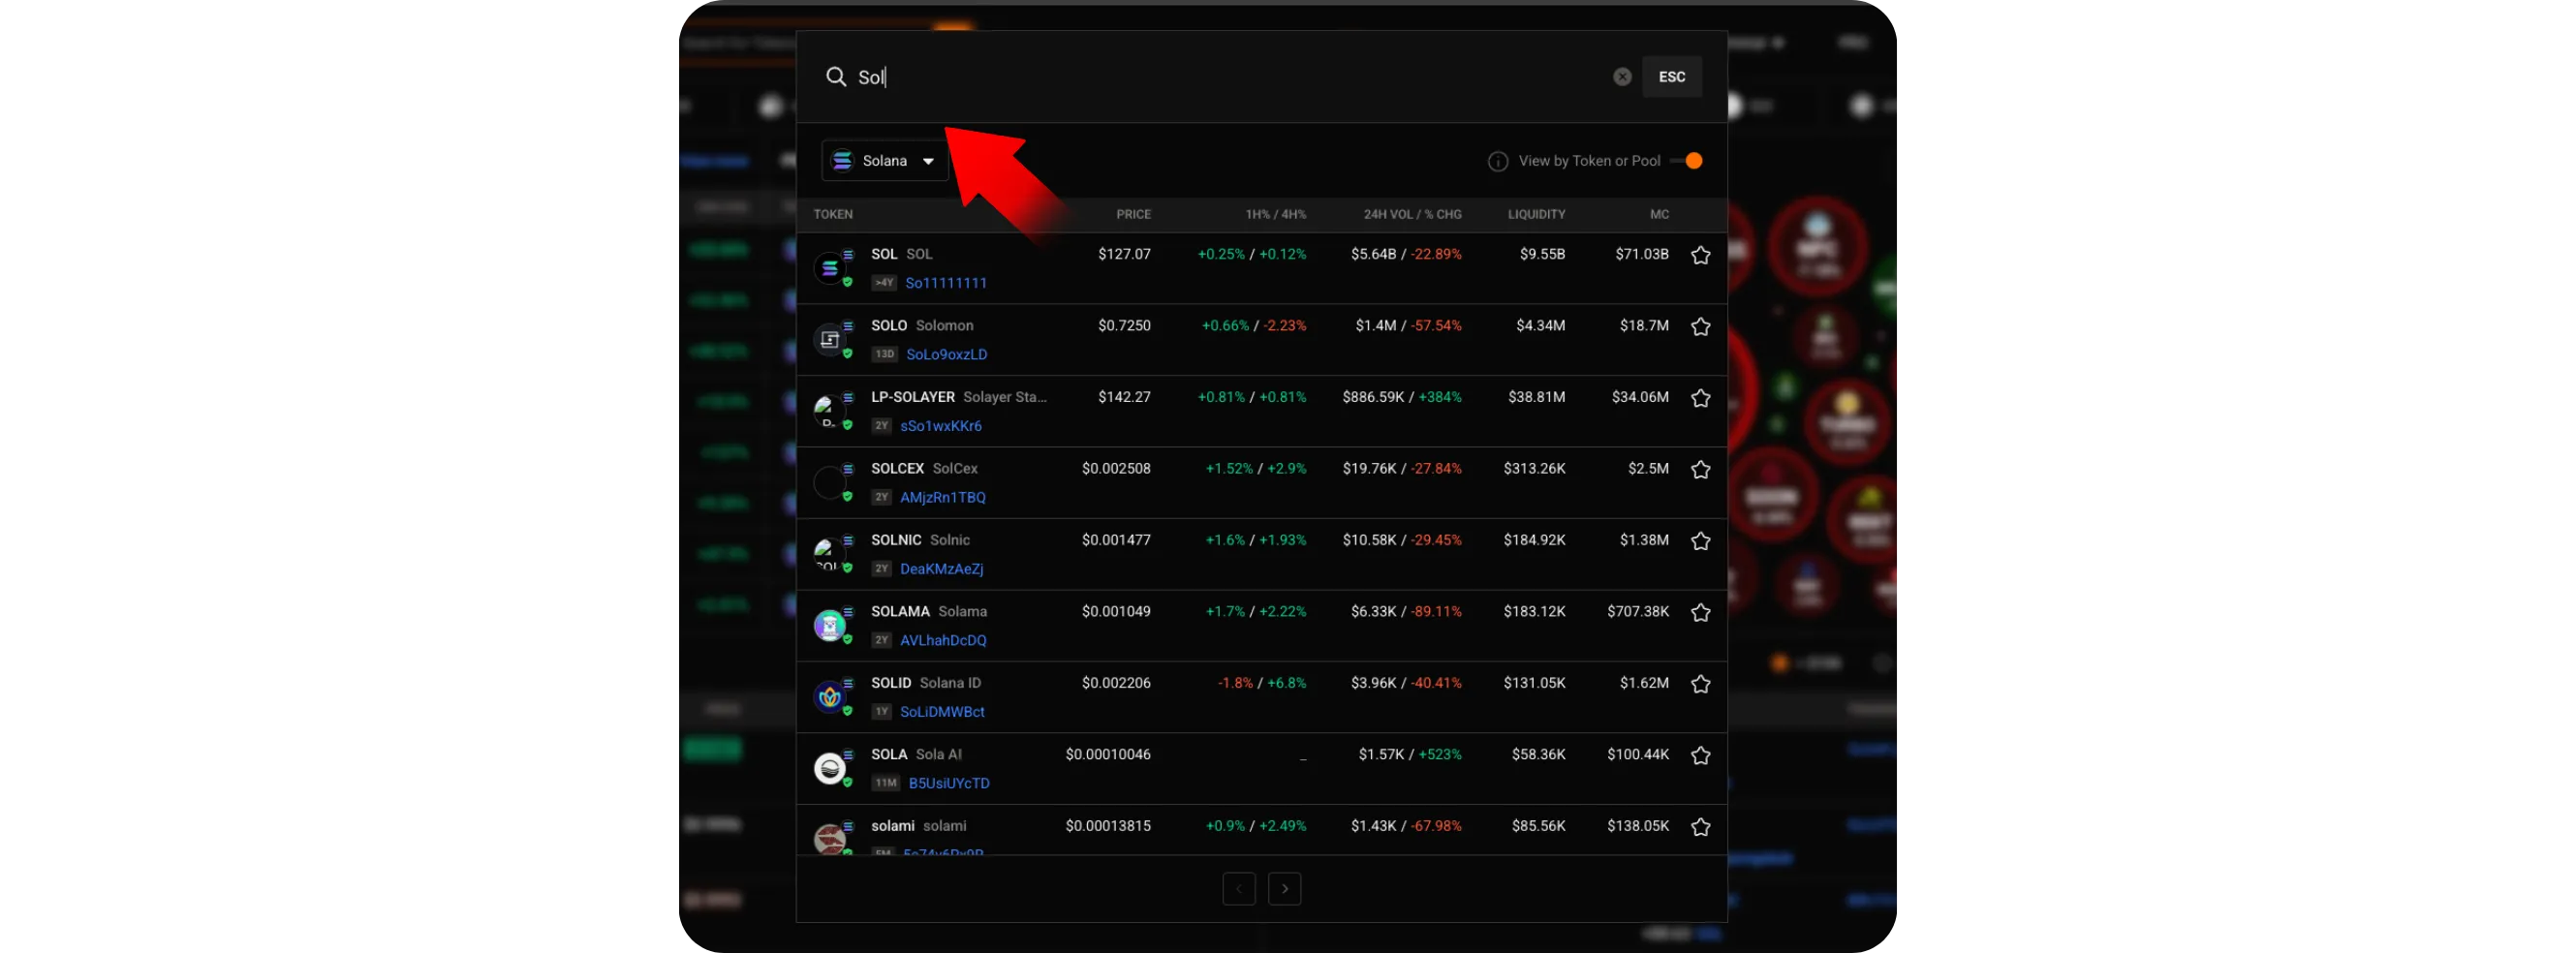
Step 2: Search for a Solana Token
At the top of the page, click the search bar.
Type the name of the token you want to explore, for example: SOL, BONK, or any new Solana token you’re curious about.
Click the token from the list to open its chart.
How to Explore XRPL NFT Collections Using Bidds.
Step 3: View the Token Chart
Once the token page opens, you’ll see everything at a glance:
Real-time price chart
Different timeframes such as 1m, 15m, 1h, or 24h
Liquidity and market cap
24h volume and trade activity
You can switch between chart types or explore additional data depending on the token.

Step 4: Review Market and Trade Details
Below the chart, you can check:
Recent trades
Buy/sell activity
Price changes over different periods
This helps you quickly understand how active the token is and how the market is moving.
Conclusion
Birdeye offers a fast and simple way to track Solana token charts, making it easy to monitor price movements, volume, and market stats.
Its clean layout and real-time updates make it one of the most useful charting tools in the Solana ecosystem.
For a broader view of blockchain activity across major networks, seeHow to Track New Blockchain Upgrades Across Major Networks Using DeFiLlama.